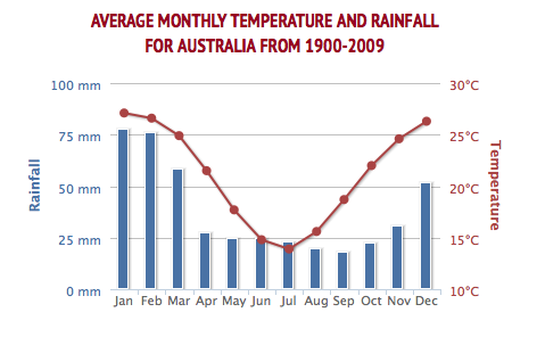
This graph shows the average monthly temperatures and rainfall of The Great Barrier Reef from 1900. From the graph we can tell that the rainfall, as well as the temperature decreases a lot during the months of May to September. The highest amount of rainfall are during the months of January and December, at around 80mm. The highest temperature is also during these months, at around 26 degrees celsius. The least amount of rainfall is during the month of July at around 20mm. The lowest temperature is also during July at about 13 degrees celsius. This is very different from the climate we live in because they're cooler months are during our spring and summer, and they're hotter months are during our fall and winter. The same thing goes for their rainfall. In Michigan, there is typically more rain in April and May, but in Australia near the Great Barrier Reef, that is when there is the least rainfall.
Information from The World Bank Group's Climate Knowledge Portal
